enerchart Energy Management System (EMS) Integration
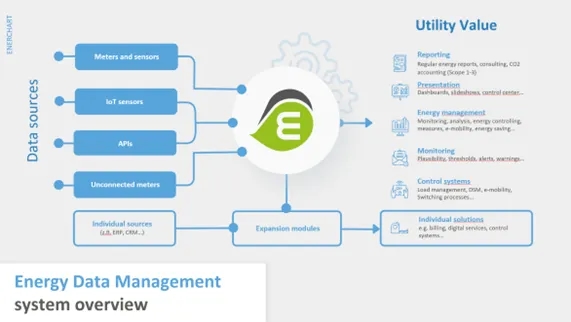
The EMS integration is based on enerchart and supports the acquisition, storage, analysis and API-based provision of energy and other time-series data. In CSSBoost it complements DAMS by enabling targeted ingestion and analysis of energy, production and business metrics.
Central time-series database for energy and non-energy data.
Automated readout from meters, data loggers, interfaces, IoT clouds and sensors.
Manual data input through forms, upload interfaces and meter-reading workflows.
Processing of common upload formats such as CSV and XLSX.
Connectivity with Modbus-TCP, OPC UA, OCPP, SNMP, FTP, SFTP, KNX, BACnet, MQTT and other systems.
Connection to IoT/cloud backends such as LoRaWAN-related platforms and other sensor infrastructures.
API-based provision of energy and time-series data for AI, monitoring and visualisation services.
Connected sources provide time-series measurements and their associated information, including data-point identity, units and timestamps. Data can arrive through configured industrial protocols, database connections, MQTT messages or files. Message decoding and interval harmonisation adapt these sources to the monitoring structure. The set of available indicators depends on the measurements and operational systems connected for the particular application.
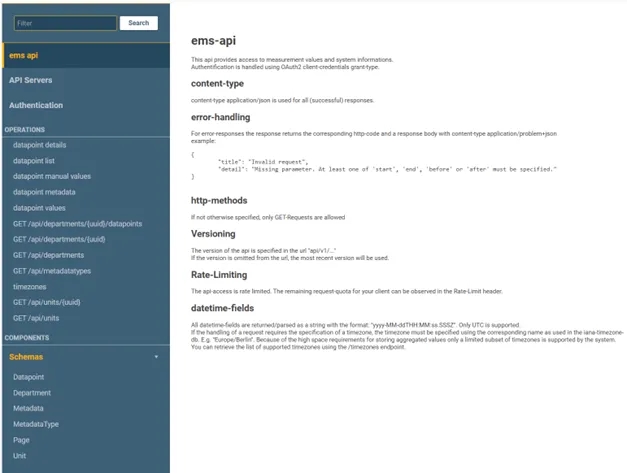
enerchart provides energy-management capabilities and integration interfaces. CSSBoost-specific integration and pilot-data connections are in progress. enerchart supports the acquisition and management of operational time-series data for energy and resource monitoring. Its scope extends beyond energy measurements to other structured information, including material-related values, prices, inventories and business metrics that can be represented as time series. The integration approach accommodates several industrial and information-system interfaces. Documented options include Modbus TCP, OPC UA, MQTT, SQL-based sources and file-based exchanges. MQTT payload decoding allows incoming messages to be adapted to the expected structure, while units and time intervals need to be harmonised so that measurements can be compared and used consistently. A JSON-based reading interface provides structured access to data points, measurements and associated information such as units and time-zone handling. Within CSSBoost, enerchart contributes to the North Black Forest pilot and to the integration of operational information with MIRA and the broader platform. The tool supports the conversion of heterogeneous source data into information that can be monitored and visualised, with the actual coverage determined by the connected systems and configured measurements.
Complete the project-specific integration and validate data mappings, units and dashboard calculations with operational inputs.
Energy measurements, timestamps, meter/source identifiers, units, organisational structure and contextual production data.
Energy monitoring views and exports based on connected measurements.
Documented EMS API; project integration with the regional platform is being completed.